Mapping the Transfer Journey
Edited on
14 May 2021A retrospective and scenario exercise for the Civic eState network
Words by Liat Rogel, URBACT Expert

When the most important times are occurring, we don't even recognize them or notice. We are just busy living our lives. Only looking back do we know what was a great moment in our lives
Federico Fellini
Civic eState URBACT network cities are now concluding a process to transfer a governance model for urban commons based on best practices from the city of Naples. The transfer journey methodology and themes were led by Christian Iaione as Lead Expert, and by the Naples municipality team as lead partner.
This article describes a retrospective and scenario exercise that adapts a tool from the discipline of Service Design to enable self-evaluation, future planning and communication of the work done.
During the Journey Mapping, the cities of the URBACT Civic eState network took a look back at their unique journeys to find perspective and reflect on their paths. Looking back allows the partners to look forward confidently, to focus on their outcomes and to map in real-time their steps and scenarios for the future to come. This exercise lasted 10 months (from March 2020 to December 2020) and included meetings, individual reviews and collective feedback sessions.
Looking back at the journey. A Retrospective Exercise
Generally, a retrospective (from Latin retrospectare, "look back"), is a look at events that took place or at works that were produced in the past. Retrospective also has specific and varied meanings in medicine, software development, popular culture and the arts.
For example, in Agile software methodologies, Retrospectives are frequently used by teams to quickly verify what went well, what did not and how things may be improved.
Similarly, creating a specific exercise and process for Retrospectives within the Civic eState network was useful for self-evaluation, future planning and dissemination.
The Retrospective is intended to reveal facts, actions or feelings which have measurable effects on the performance of a city until a certain point. It is made to construct ideas for improvement based on these observations. Retrospectives promote ownership and responsibility by the project team with respect to all aspects of the journey, and participants can understand the rationale behind all decisions. This process and its final results are a complementary tool to the Learning Logs. I chose a tool from the Service Design discipline to guide this Retrospective: the User Journey Map.
User Journey. A Service Design Tool
Journey mapping is a schema used widely in Service Design. It allows designers to visualize the path of a user in a specific service and understand the actions and interactions a user engages with in order to reach a specific objective. For example, a Journey Map for a hotel would map every time a customer interacts with hotel staff or products, including searching for a hotel and leaving a review after the visit. In parallel to these specific actions, emotions like satisfaction and frustration are evaluated at each point to empathise and recognize the various pain and gain points for the user during their journey.
User journeys utilize a high level of detail to describe exactly what steps different users take to complete a specific task within a system, application, or website. This technique displays the actual (as-is) user workflow and reveals areas of potential improvement for the to-be workflow. When documented, this artefact is often referred to as a User Journey Map.
User Journey Maps may come in different forms. The basic shape is a linear timeline, where time is divided into specific phases of the journey horizontally, while vertically we find one or more types of users or tasks.

Examples of User Journey Maps
Adapting the tool to a best practice transfer and integrating with Design Indicators
The cities in the Civic eState transfer network were more than half-way through their journey when we introduced the Journey Mapping tool. The idea was to adapt the tool in order to help each city reflect on its journey,understand the most important points and what there is to learn from their challenges along the way. The tool was built by following a traditional user journey structure and then adapting it to the specific context of Civic eState. Starting and Ending Points were included to evaluate the progress of the cities. The set of indicators chosen for the evaluation were derived from the Co-Cities Open Book, a research project carried out by LUISS and Guglielmo Marconi Universities aimed at providing methodological principles, case study analysis, and quantitative tools to help implement and measure the level of implementation of the Sustainable Development Goals and the New Urban Agenda (labgov.city/co-city-protocol/the-co-cities-open-book/)

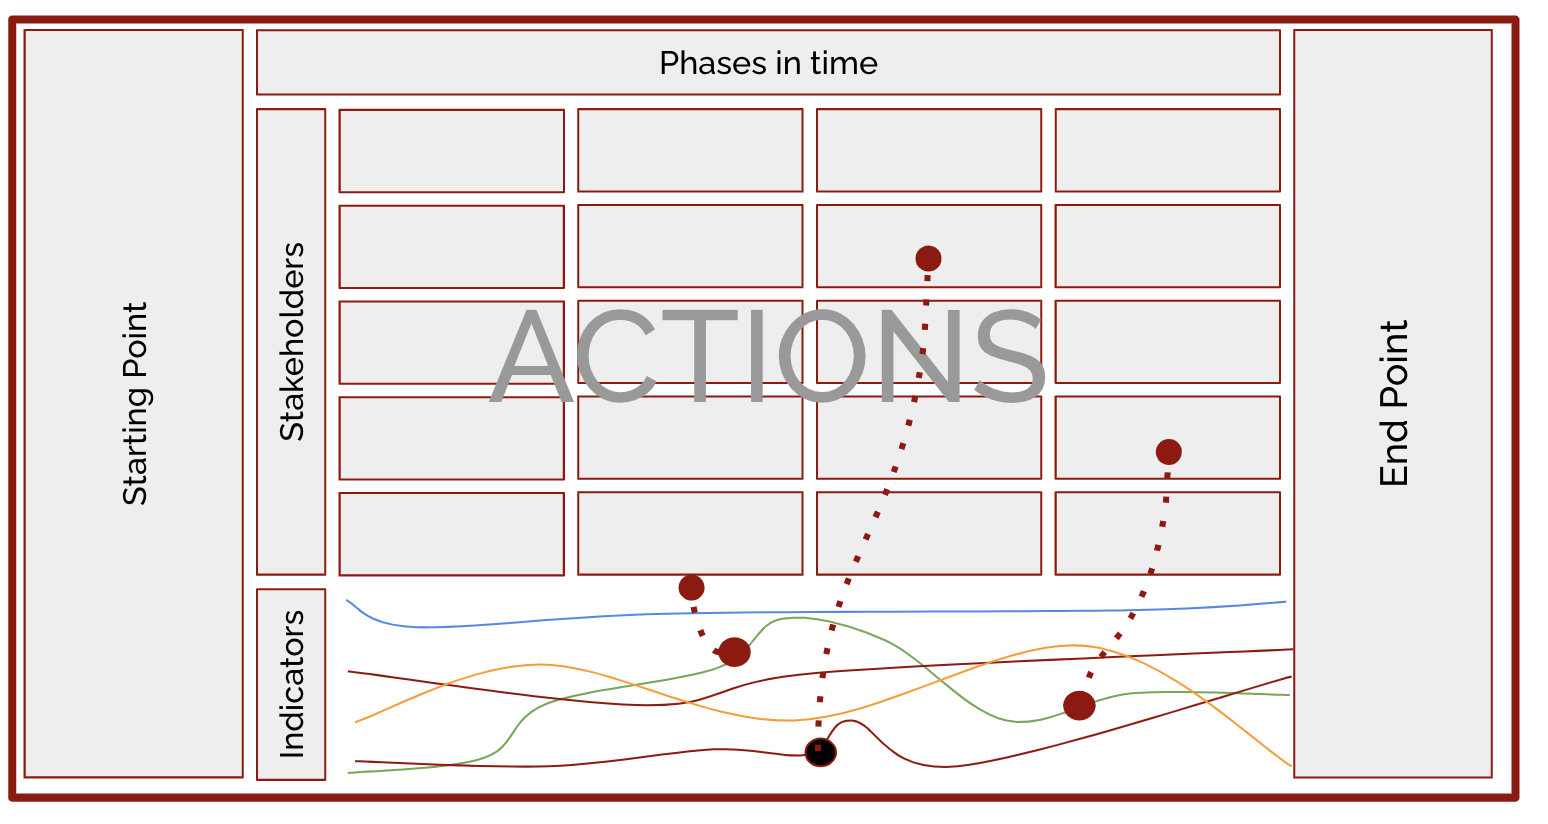
Overview of the Journey Mapping Tool Civic eState
The Starting Point describes the city and various aspects of its individual context as it was when it entered the project such as the reason for participation, the available assets, the challenges and the objectives. It also described the current policy in place and the stakeholder(s) already involved. Lastly, it included a self-evaluation tool following the Design Indicators derived from the Co-Cities Open Book (www.commoning.city), described below.
- Co-Governance refers to the presence or absence of a self-, shared, collaborative or polycentric organization for the governance of the commons in cities;
- Enabling State expresses the role of the State in the governance of the commons and identifies the characteristics of an enabling state that facilitates collective actions for the commons;
- Social and Economic Pooling is the distinction between an urban governance scheme based on co-governance, and an urban governance scheme based on urban pools, This variable is maximized when civic actors adopt a more entrepreneurial approach;
- Experimentalism is the presence of an adaptive, place-based and iterative approach to design legal and policy innovations that enable the urban commons;
- Tech Justice highlights the potentiality of digital infrastructures and access to technology in particular for vulnerable people and communities as an enabling factor of collaboration, local development and social cohesion.
The Journey in the middle section highlights the main actions done by separate stakeholders in different phases of the project. These phases followed those of the transfer process itself. Beneath the actions, the cities had to evaluate their state in a specific phase, or bring attention to a specific event that influenced their progress using the Design Indicators described above.
Finally, the End Point describes the changes in the assets, in the policy, and in their ULG’s composition. It also describes effective strategies for overcoming challenges and the evaluation and evolution of their initial objectives. This is where the partners were given the opportunity to reflect on their lessons learned and imagine a realistic, future scenario. Self evaluation results were meaningful for defining the present and future steps and detailing new objectives.
Filling in and Sharing Experiences
Using this tool to fill out their unique journey became a good time to share a moment of reflection with the cities. The tool was introduced during an online meeting with all partners and each participant had the opportunity to begin. Then, 1-on-1 meetings were held with each city to deeply explore their journey, going into more detail and, most of all, to enable a better understanding of the effect that the journey (or part of it) had on the city administration, policy and ULG.
During these 1-on1 meetings, participants were asked to describe the “story of their journey,” verbally, as if to an outsider. They then summarized this story in a one-pager and finally, delved into the details, step by step. Looking back at the journey with the eye of an external observer resulted in a fun and interesting exercise and proved to be extremely useful for extracting insights.
The End Point was filled in by the partners before another transnational meeting online. During this meeting, the partners shared their end points with each other and exchanged perspectives and results from the outcomes of the experiences.
Working closely with the partners to fill out their journey using the tool guaranteed that the tool was not only an analytical or visualisation aid, but a co-produced, shared reflection on the whole process.

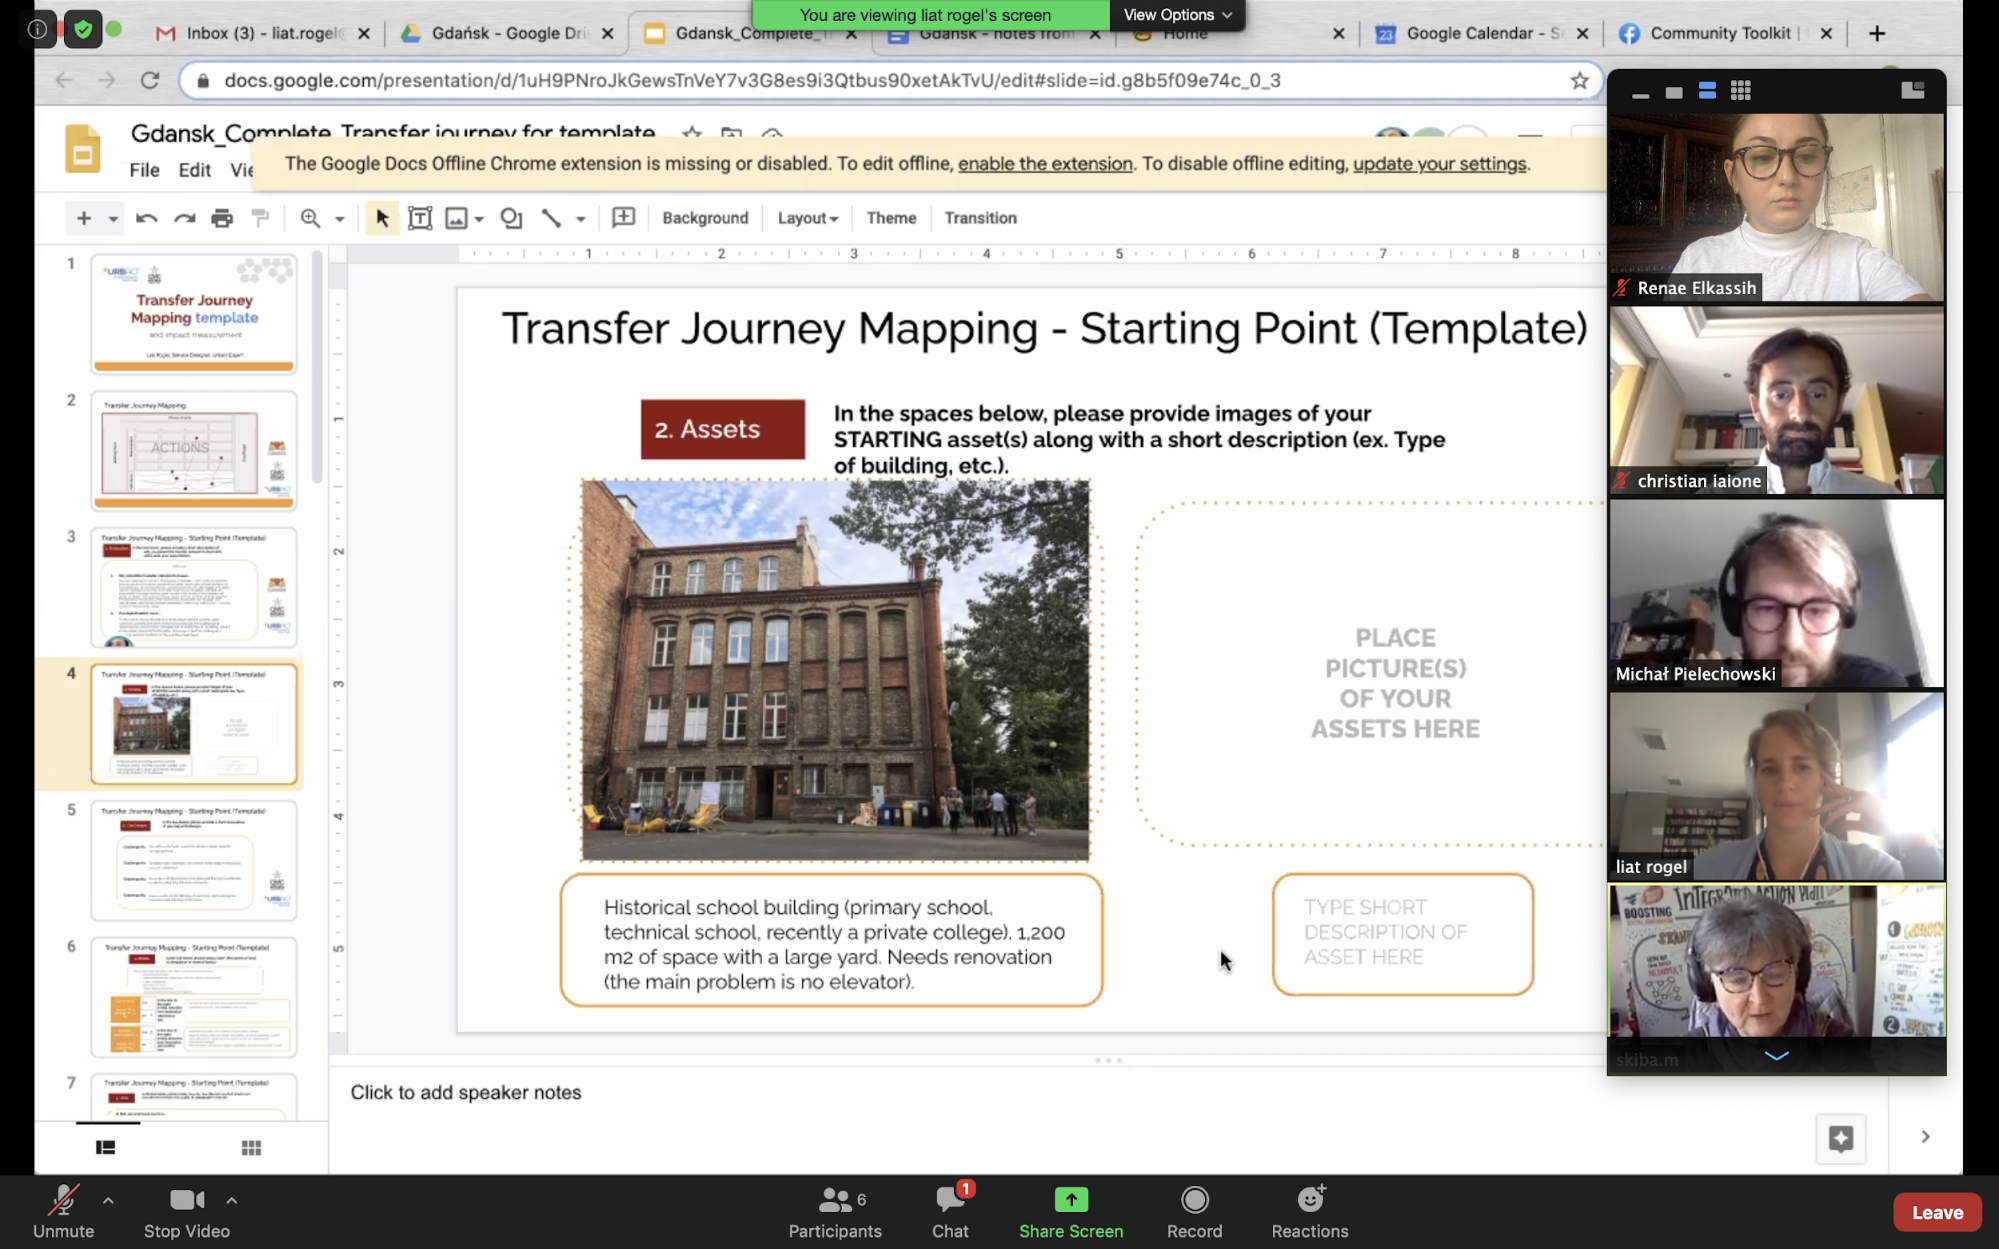
An online Transfer Journey meeting with Gdansk
Visualizing the journey
The last part of the Exercise was about transforming our insights into a visualisation; a way to communicate the journey both internally and to a larger public. It was important not to focus only on the results, but to also give space to the starting point and the process in order to more deeply understand how challenges were overcome and objectives reached. To this end, the online interactive presentation software Prezi was used for the visualization of each city’s journey. It is a tool that allows you to observe the whole process, or zoom into some of the details. This makes it accessible to different target audiences. Using a visualisation tool in this way transforms a city’s journey into a coherent and complete story, which enhances both the experience of the viewer and the ability to demonstrate the context and environment surrounding a city’s path throughout Civic eState, including its inevitable challenges, its accomplishments and current status. The viewer is able to choose the level of detail for each phase of a city’s journey insofar as having the ability to click on links outside of the visualisation itself and view individual sources, while being guided along a general path at the same time.
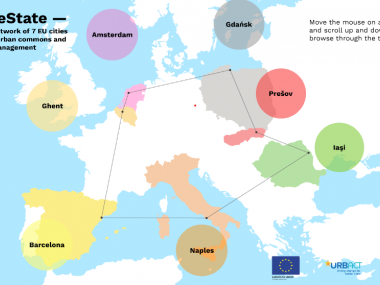
Move the mouse on a city and scroll up and down to browse through the topics (full screen view recommended)
Conclusion
The Retrospective focus on the journey, using Service Design tools and adapting them with our specific Design Indicators allowed a fresh viewpoint on the events done by that point. It showcased an effective starting point, both for the mapping of ongoing actions carried out by each city of the network and for the final scenarios containing the steps that will take place in the near future. We believe this exercise would be useful for other cities interested in a similar path and chance for reflection and insight.
Liat Rogel, URBACT Expert
 Submitted by Gregorio Turolla on
