
Urban data scan
Contact
Cities are always evolving, as are the variety and availability of urban data. Antwerp (BE) invests in a smart city strategy and strives to be a “walkable city” with mixed, high-quality neighbourhoods. To do so, for nearly a decade Antwerp has been using an “urban data scan” which maps out specific needs, problems and opportunities. Multitudes of geo- and statistical data are structured around different themes to provide a clear overview of the most relevant data. This allows policymakers to develop substantiated visions and make informed spatial decisions. Progress can be monitored for all kinds of projects and developments. Two online platforms share these data and maps with city employees, citizens, companies, project developers and other cities. The urban scan is all about optimising and sharing data, preparing good spatial decisions, and building a better city for all our citizens and partners.
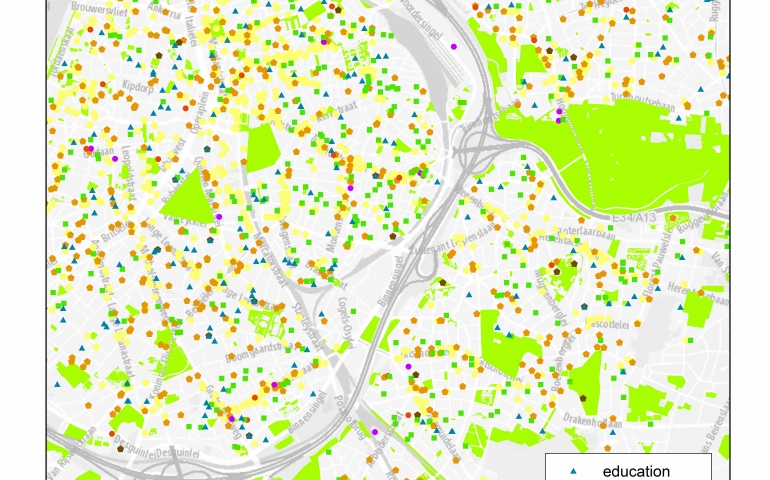
Urban data scans provide a method to map out needs and shortages specifically for local amenities (e.g. schools, sport, green spaces, culture, commerce, well-being, youth). First, the capacity is gauged by analysing the number or area of amenities per target group. Next, the reach, or relative proximity and distribution of these amenities, are determined based on walking distances. Local amenities differ in reach, functioning either at the level of the neighbourhood (400 metres), a residential quarter (800 meters) or urban quarter (1 600 metres). This twofold approach creates a clear picture of needs and shortage zones, allowing policymakers to balance the distribution of amenities, based on walking distances and target groups. Simulations also allow us to take into account future residents in project areas and to calculate effects in terms of new needs or required new amenities. This enables informed policy decisions and provides a strong base for financial and strategic negotiations with all the parties involved.
For example, an urban scan has led to the decision to provide a 17-hectare park (Park Spoor Noord) in the densely populated Antwerpen-Noord quarter. New green spaces, but also schools, nurseries and sports facilities were incorporated in projects such as Nieuw Zuid, Groen Kwartier and Eilandje after thorough urban scans. The urban quarters outside of the inner city, across the Singel and Ring roads, are mapped out extensively as well.
The urban scan enables a horizontally integrated approach. It involves structuring large sets of data according to a multitude of themes and provides insight into socio-demographics, economy, housing, the legal context, mobility, environment, well-being and built and unbuilt amenities. As such, urban scans form a strong base for sustainable and integrated policies, not only in the field of spatial planning, but for other policy domains as well. The right amounts of green and open spaces, schools, sport, culture, children’s and youth’s amenities, commerce and well-being are crucial in promoting attractive urban environments. Moreover, walking and cycling distances stimulate sustainable urban mobility. The city has user-friendly tools to help make all these data and maps available for its own employees, citizens, entrepreneurs, research agencies, project developers, other cities and higher-level governments. The latter enables a vertically integrated approach. The integrated use of statistics and maps further increases the importance of data sharing.
The urban scan is a participatory and flexible instrument that has developed organically in close consultation with several partners. Fifteen years ago, the main goal was to analyse the city’s green structure. Evolving insights, amenities, data and users’ experiences have ensured that the urban scan is still an innovative tool today. Air and noise pollution, for instance, have become important themes and are now included in the scan. The platforms that share the maps and data with citizens, companies, research agencies, project developers and other cities and governments are important communication and sensitisation tools. City neighbourhoods and even cities can be compared, knowledge is shared, ambitions and goals are monitored and other governments and partners are stimulated to analyse and share their own data.
Stad in cijfers (“city statistics”) is Antwerp’s interactive online data platform. Since 2009, it has amassed more than 5,000 layers of data, structured according to themes, scales and dates. The data can be presented in tables, charts and maps and can be consulted, analysed and compared in space and time. Other Flemish and Dutch cities use the same system. Since 2013, the city also has an intranet platform for geo-data, a GIS-viewer with more than 1,000 data layers. Stad in Kaart (“city maps”) allows city employees to request information and to perform simple spatial analyses. Combinations of geo-data often provide more insight than data organised in tables.
Urban scans increase policymakers’ awareness of shortages and needs in terms of green spaces, nurseries, sport, culture, commerce, well-being and youth. Statistical data and maps indicate areas to invest in and enable the right choices. This method is used for up to 90% of urban development projects in Antwerp. Apart from amenities, the scan also sheds light on the demographic, social and economic dynamics in residential quarters. Environmental quality, mobility and housing are taken into consideration as well. And because the scan has existed for a number of years, evolutions can be traced.
In the district of Hoboken, for example, a project for low-skilled employment targeted residential areas with many unemployed citizens. Likewise, measures in the Ring Road area are focused on reducing air and noise pollution. In former port area Eilandje a new tram line brings public transport within walking distance for residents. And urban scans also lead to the development of new green spaces. The importance of the scan has even increased in the past year because it has become mandatory for large private developments. The desired programme needs to be negotiated and must be implemented or financially compensated. The urban scan thus has an important potential impact on the choices that are made within projects.
Because cities are continuously evolving, they are always first to face new challenges and problems, such as demographic evolutions, urban mobility, air and noise pollution, inclusion of migrants and refugees, housing, urban poverty and the digital transition. Throughout these evolutions, it is crucial to strive for optimal functional mixes (living, working and recreation) and mixed neighbourhoods with local amenities within walking distance of citizens. Because the urban scan touches upon all the relevant themes for the ambition of a walkable city with liveable and healthy neighbourhoods, it forms a perfect tool for sustainable urban projects. Urban scans consistently take into account new insights and data, making them a flexible instrument for evolving and complex cities. The systematic method of the urban scan enables policymakers to make the right choices and brings order in the increasing amounts and availability of data.
The online data platforms enable comparisons with other cities of similar sizes. Those cities can exchange relevant data and knowledge. Most cities already have a platform or collection method for data about city quarters and neighbourhoods. The urban scan can help broaden European instruments such as the Urban Audit, substantially as well as in terms of their scope (city quarters and neighbourhoods). If the required competencies and political support are present, the method is certainly applicable in other cities.