
Systems Tools for City Systems
Edited on
29 November 2018As cities and societies becomes increasingly complex and unpredictable, the traditional decision making models and strategic development tools, fall short of providing the required synthesis, clarity and perspective over the social system we are trying to improve. This article, presents a simple case-study on how to create better clarity out of simple public consultation process. The process described here is based on notions from systems thinking, complexity and network theory.
Context
Amarante, Portugal. A city located 50km away from Porto, nestled between the famous Douro River Valley and the Mountain ranges of Marão. Amarante is one of the cities belonging to the City Center Doctor (CCD) network and has been carrying out a series of public consultations since December 2016 to diagnose the health of its city-center. One of the actions carried out by the URBACT Local Group consisted of using the Start-Stop-Continue-Improve assessment tool. This simple tool consists of asking people on the streets what they would like to see started, stopped, improved and continued in the city center. This exercise was done twice in Amarante. First, we heard the voices of our European partners during a visit of the group to Amarante in December. Then, in January, the local group took to the market on a Saturday morning and spent a good part of the morning asking shoppers to contribute to this diagnosis exercise. The exercise, besides being fun and engaging, produced several “post-it notes” with dozens of ideas and suggestions, some of them quite unexpected.
What to do with all the “post-its”?
Adding metadata
Network Analysis
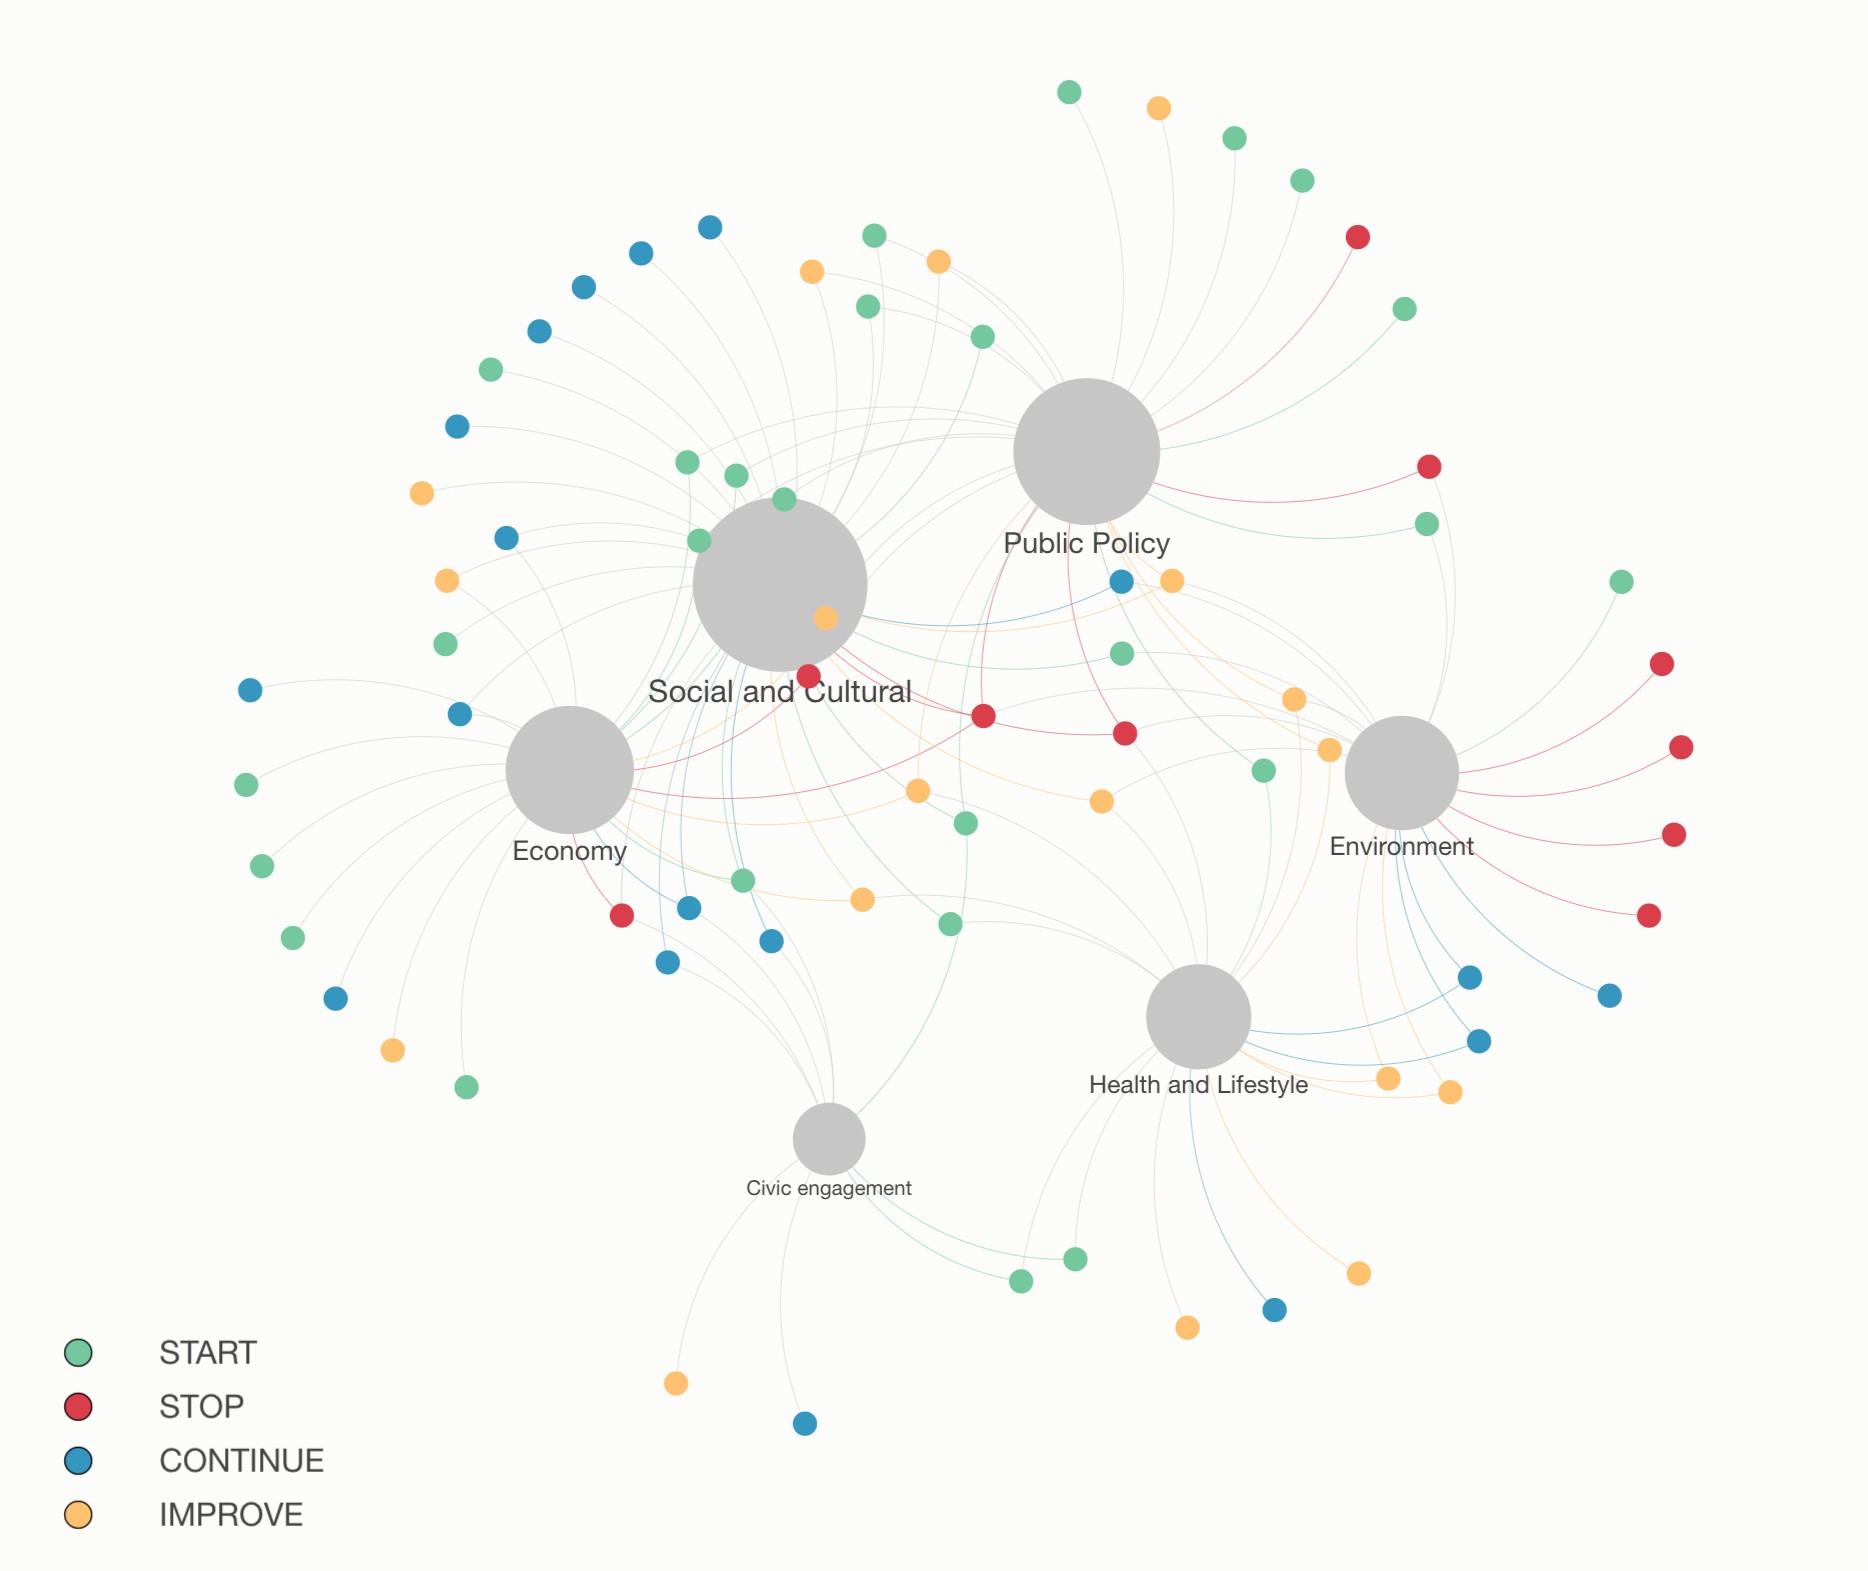
 With the actions now transformed into nodes of a network, we may use network analysis tools and metrics to derive some conclusions from this exercise. Here are two examples:
1. The QoL factor with the most actions appended to it, is “Social and Cultural” with 32 actions, followed by “Public Policy” with 26.
2. The two actions with highest impact potential are the ones related to “preservation of landscape and heritage” and “conservation of green space and environment”.
The first conclusion results from calculating the “degree” of each node of the network consisting of the actions, the QoL factors and the tags. The second conclusion was derived by calculating the “eigenvector centrality” of each node. “Eigenvector centrality measures how well connected an element is to other well connected elements. In general, elements with high eigenvector centrality are the leaders of the network, though they may not have the strongest local influence.” The argument is that dealing with actions with higher eigenvector centrality will have an indirect impact in several other QoL factors.
The age of synthesis
We live now in an extremely complex and uncertain world and we urgently need new tools to assist in decision and strategy making. The age of analysis and linear thinking has taken us this far. We are entering the age of synthesis. For urban systems, this means that we are able to characterise and promote the elements of the urban ecosystem very well. Now it’s urgent to focus on the interactions, the relationships and the behaviour that emerges from the interactions between them. This examples shows how the use some concepts of systems thinking together with powerful
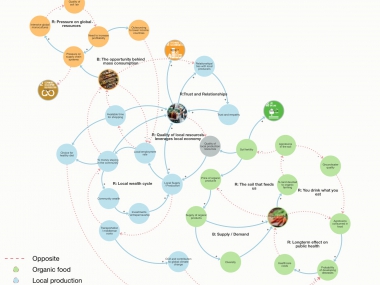
visualization tools can help urban strategists make more sense of data gathered from simple public consultation like the start-stop-continue-improve approach. But the promise of systems thinking and network analysis tools doesn’t end here. Here is another example being developed in Amarante by Casa da Juventude where we are trying to raise awareness of the public for supporting local organic farming and Fair Trade and the Sustainable Development Goals.
 Submitted by Alberto Ferri on