
Steering the real-time city through urban big data and city dashboards?
Edited on
12 January 2018In this article, Prof. Rob Kitchin of Maynooth University discusses the emergence and growth of smart city agendas in Ireland – and the role of dashboards in both visualising open and shared data and allowing city managers to monitor how a city is performing at particular points in time and govern it accordingly.
Prof. Rob Kitchin, National Institute for Regional and Spatial Analysis (NIRSA), Maynooth University
There’s a long history of data being generated about cities and these data being used to understand city life, solve urban problems, formulate policy and plans, guide operational governance, model possible futures, and tackle a diverse set of other issues. Consequently, how cities are understood and managed have been data-informed for centuries. More recently, how we come to know and govern cities is changing as the nature of urban data and how it is utilised is transformed. Urban big data is producing new forms of data-driven urbanism, helping to produce what has been termed “smart cities”.
Urban big data constitutes a broad class of data that are generated continuously, exhaustively and at a fine scale about people and places. Such data are produced by networked sensors, actuators, transponders, cameras and software-enabled devices embedded into the fabric of cities, the smart phones and apps that people use, locative/social media and citizen science initiatives, and interactions and transactions across networked systems. A diverse range of public and private bodies are producing big data about citizens and cities, including utility companies, transport providers, environmental agencies, mobile phone operators, social media sites, home appliances and entertainment systems, financial institutions and retail chains, private surveillance and security firms, and emergency services. This deluge of actionable data are feeding into management systems and control rooms, being used to monitor and manage urban tasks and operational governance in real-time (see Figure 1), and provide the inputs for imagining, predicting and simulating urban futures through big data analytics. The Rio de Janeiro control room, for example, as shown in Figure 1, draws together real-time data streams from thirty agencies as a means to try and manage a large, complex city.
Figure 1: Urban control rooms (Rio de Janeiro, Kashiwa City [Tokyo])
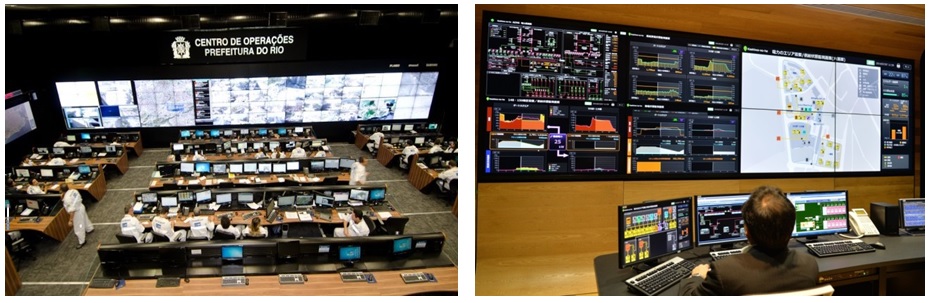
Source: Left: http://ipprio.rio.rj.gov.br/centro-de-operacoes-rio-usa-mapas-feitos-pelo-ipp/
Right: http://www.citymetric.com/horizons/big-tech-firms-are-wrong-we-must-build-smart-cities-ground-1590
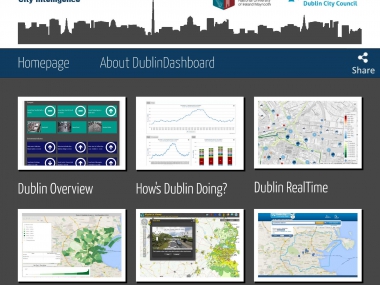
A key means to make sense of urban big data is to visualise them through interactive maps and graphs. These are increasingly organised within city dashboards – along with more traditional datasets relating to cities such as public administration data – that are used by city managers and analysts to monitor how a system or the city as a whole is performing. Sometimes these dashboards are also made open to citizens, such as the Dublin Dashboard, for which I am the principal investigator (see Figure 2).
Dashboards act as cognitive tools that improve a user’s ‘span of control’ over voluminous, varied and quickly transitioning data and enable a user to explore the characteristics and structure of datasets and interpret trends. The power and utility of city dashboards is their realist epistemology and instrumental rationality and their claims to show in detail and real-time the state of play of cities – to know the city as it actually is through objective, trustworthy, factual data; to translate the messiness and complexities of cities into rational, detailed, systematic, ordered forms of knowledge. In essence, dashboards enable a user to understand what is happening in a city system at any point in time and to act on that data – to steer the city through a set of visualisations and data levers in much the same way as a driver is presented with data via a dashboard and reacts accordingly. And if the data are made open then others can use the data to create business value and civic apps.
Figure 2: City dashboards (Dublin, London, Chicago)
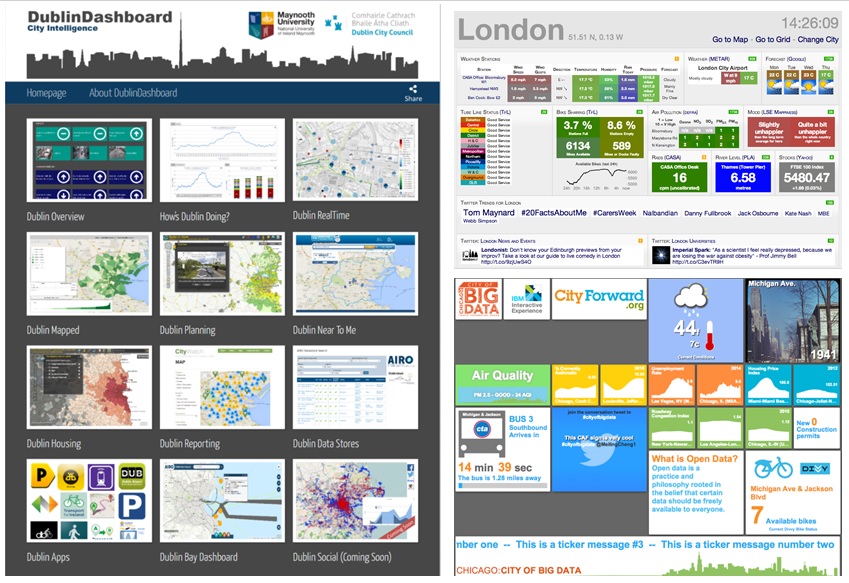
Source: Left: http://www.dublindashboard.ie/; top-right: http://citydashboard.org/london/ bottom-right: bigdata.architecture.org
While city dashboards seem to provide a powerful, new data-driven way to know and govern cities, they are not without critique.
From a technical perspective, there are a number of issues with respect to the data themselves and the analytics used. Much big data are plagued with issues of veracity, that is, accuracy and fidelity, and are often published with little or no metadata concerning measurement, sampling frame, handling, uncertainty, error, bias, reliability, calibration, lineage that enables analysts to judge data quality. Moreover, these data are then processed and analysed by algorithms that are black-boxed, meaning the calculations performed are not open to scrutiny. As with all systems that are dependent on data, garbage in and poor analytics leads to garbage out and flawed decision making. In addition, the visualisations displayed are open to a number of ecological fallacies that significantly shape interpretation (e.g., the same data displayed at different scales can show markedly different patterns).
From an epistemological perspective, some critics note that dashboards are not neutral, objective, technical, commonsensical tools that simply reveal knowledge about the world. Rather, the approach adopted is reductive, atomising complex, contingent relationships into simple measures. Indeed, it is important to remember that the data generated do not exist independently of the ideas, instruments, practices, contexts, knowledges and systems used to generate, process, analyse and interpret them. As such, they are not objective and neutral, but are shaped by the wider socio-technical assemblage that produce them and are invested with the values of those that create and deploy them. Moreover, the focus on narrowly framed factual information decontextualises a city from its longer historical context, politics, governance and culture. As such, the data, configuration, tools, and modes of presentation of a dashboard produce a particularised set of spatial knowledges about the city and while the dashboard might seek to show the city as it actually is, it is inevitably partial and limited. Dashboards only visualise a sample of the data that exists with respect to a city, and these data are just a small subset of everything that could potentially be measured. Further, how the data are presented is mutable, meaning that how the data are communicated shapes what the user can see and engage with and delimits what questions can be asked of the underlying data and what answers can be obtained.
From a political and governmental perspective, city dashboards have been critiqued for enacting and promoting a form of technocratic governance and expressing a particular set of normative values. City dashboards fit within a wider set of smart city technologies that emphasise treating urban issues as technical problems that can be solved through technical approaches. Such approaches are based on the premise that cities are largely rational, mechanical, linear and hierarchical systems and can be disassembled into neatly defined problems that can be fixed or optimised through computation. Such a view promotes a technocratic, top-down form of governance in which city managers can steer and control the city through a set of data levers and ignores the fact that dashboards are full of politics and normative assumptions and effects. With regards to the latter, this includes notions about what should be measured and for what reasons, with the information produced being used to influence decision-making, modify institutional behaviour, condition workers, nudge consumers, socially sort individuals, etc. In contrast, others note that cities are fluid, open, complex, multi-level and contingent systems, full of competing interests and wicked problems that are not well captured in dashboards and are often best tackled through political/social solutions, policy interventions, and citizen-centred deliberative democracy, rather than technical fixes.
A key aspect of building the Dublin Dashboard has been to consider these critiques to try and find a balance between the utility of city dashboards and their limitations. City dashboards undoubtedly provide a wealth of timely, longitudinal and citywide information, but they are also partial, framed, normative, and enact a particular form of technocratic governance. Our strategy has been to explicitly and openly recognise the technical and epistemological shortcomings of city dashboards and to advocate that they are used contextually and in conjunction with other forms of urban knowing and governance, rather than replacing them with a limited form of understanding and a narrow, instrumental form of governance. In other words, rather than opposing the use of dashboards, we have sought to re-imagine them, explicitly recognising their inherent politics, praxes, contingencies and limitations. We think it is an approach that would benefit other smart city technologies.
Further reading:
Kitchin, R. (2014). The real-time city? Big data and smart urbanism. GeoJournal 79(1): 1-14.
Kitchin, R., Lauriault, T. and McArdle, G. (2015). Knowing and governing cities through urban indicators, city benchmarking and real-time dashboards. Regional Studies, Regional Science 2: 1-28.
Kitchin, R., Maalsen, S. and McArdle, G. (2015). The praxis and politics of building urban dashboards. Programmable City Working Paper 11. http://ssrn.com/abstract=2608988
Luque-Ayala, A. and Marvin, S. (2016). The maintenance of urban circulation: an operational logic of infrastructural control. Environment and Planning D: Society and Space 34(2): 191-208.
Mattern, S. (2015). Mission Control: A History of the Urban Dashboard, Places Journal https://placesjournal.org/article/mission-control-a-history-of-the-urban-dashboard/
McArdle, G. and Kitchin, R. (2015). Improving the veracity of open and real-time urban data. The Programmable City Working Paper 13 http://ssrn.com/abstract=2643430
Townsend, A. (2013). Smart Cities: Big Data, Civic Hackers, and the Quest for a New Utopia. W.W. Norton & Co: New York.
Acknowledgement
The research for this paper was provided by a European Research Council Advanced Investigator Award, ‘The Programmable City’ (ERC-2012-AdG-323636). For further information, see http://progcity.maynoothuniversity.ie/
Submitted by Caroline Creamer on